Guides du thé et des objets à thé
Global Tea Trade: How the Network Changed, 2005–2020

A cup of tea may begin in China, Kenya or Sri Lanka, pass through a blending or packing business elsewhere, and reach a customer thousands of miles away. Looking only at the largest growers misses much of that journey.
That is the useful idea behind the FAO study Changes in the global tea trade network. It examines how countries were connected through tea imports and exports between 2005 and 2020. The picture that emerges is a wider network, with more trading partners and a growing role for businesses that add value to tea after it leaves its country of origin.
About the dates: this guide draws on FAO’s report published in May 2024. Its trade data describe 2005–2020, with a separate regional comparison for 2010–2020. They are historical findings, rather than a ranking of today’s tea markets.
Global tea trade grew, but markets moved at different speeds
FAO reports that global tea trade expanded by an average of 1.1% a year from 2005 to 2020. Behind that modest overall rate, individual markets followed quite different paths.
Exports from China, India and Vietnam increased, as did shipments from Kenya. Uganda and Rwanda recorded faster export growth from smaller starting volumes. On the buying side, Pakistan’s tea imports rose by about 5% annually, while Egypt’s increased by nearly 2%. U.S. import volumes remained comparatively steady; those of the United Kingdom and Russia declined slightly.
These differences help explain why “the global tea market” is rarely one market in practice. Changes in household demand, established drinking habits and routes to market affect each country differently. A stable market for everyday blends can sit alongside a growing audience for a particular origin or style.
More countries were trading tea with more partners
The number of tea export links grew by roughly one-third during the study period. Across the countries in the sample, there were, on average, seven more trade links per country in 2020 than in 2005.
Here, a trade link means a connection between two countries through tea imports or exports. It does not tell us how many containers moved, how valuable the tea was, or how often the partners traded. A country can have many partners without being the largest exporter by weight.
China, India and Sri Lanka were the exporters with the most trading partners. Canada and the United States stood out for import connectivity. Türkiye developed more export connections, while Brazil, Canada and China broadened their import connections. The United Arab Emirates strengthened its connections in both directions.
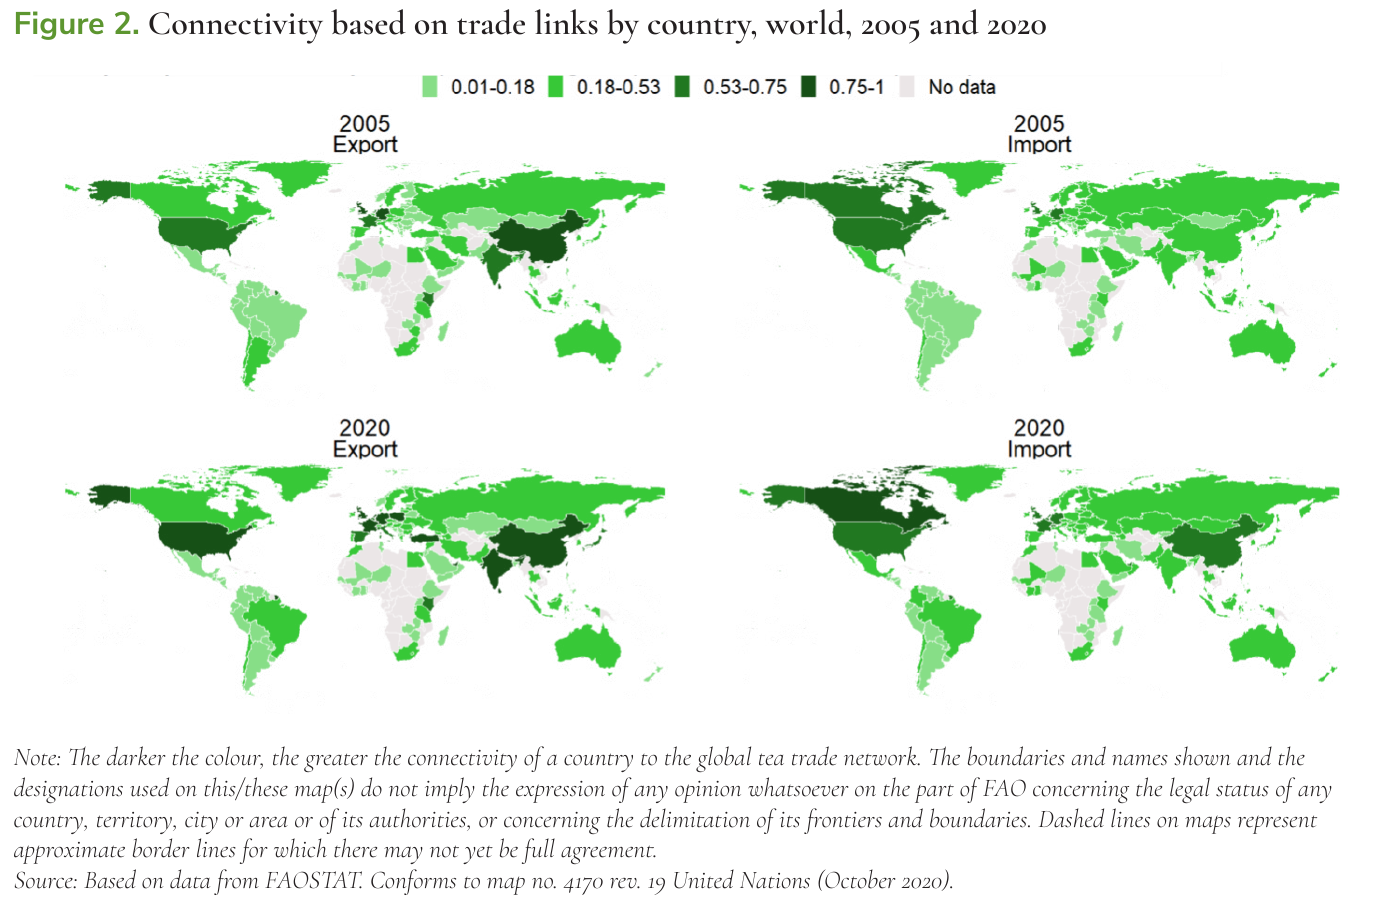
Connectivity is not market share
The distinction matters when reading the maps. FAO’s connectivity index runs from zero to one and compares actual trade links with the number theoretically possible. An index of 0.2 describes the breadth of a country’s connections; it does not mean that country accounts for 20% of global tea imports.
Nor does a wider network mean every country trades with every other country. The finding is more specific: many countries had more partners by the end of the period, and export connections were distributed more evenly than before.
Why tea-growing countries and trading hubs are different
Climate and growing conditions still give established producers an important place in tea exports. But tea also moves through countries that import it, prepare it for another market and export it again.
In 2020, the European Union, the United Arab Emirates and the United Kingdom together re-exported 138,540 metric tons of tea as value-added products, according to the report. This helps explain why a country can be prominent in tea exports without growing all the leaf it ships.
For a buyer, the distinction is straightforward. Where tea was grown, where it was processed or packed, and where it was shipped from can be three different places. A shipping address alone cannot establish the origin of the leaf.

The export network became less dependent on a small number of central hubs. Traditional exporters, including China, Sri Lanka and Japan, occupied less central positions in the 2020 diagram than in 2005 as other connections and re-export hubs developed.
This is a change in their relative position within the network. It does not, by itself, show that their exports fell. The import network changed less visibly, and its movement toward a less concentrated structure was less pronounced.
Regional tea trade: reading the 2010–2020 comparison
The regional chart asks a different question: how much tea trade stayed within a region, and how much crossed into another one? These shares are measured by trade value, not by the number of partners or the weight of tea shipped.

- Africa: the share of exports going outside the region rose from about 70% to about 80%. The share of imports sourced within Africa fell from roughly 55% to 40%. In other words, trade with other regions became more important in both directions.
- The Americas: around 80% of exports remained within the region, while about 75% of imports came from other regions. The Americas here means the regional grouping, rather than the United States alone.
- Asia: export shares remained relatively steady, with about 45% staying within the region and 55% going elsewhere. The share of imports arriving from outside Asia rose from around 30% to 40%.
- Europe: the shares of both exports and imports traded within the region increased slightly.
Reading note: the Chinese review reverses several of these directions and gives an inconsistent year in its chart caption. The comparison above follows the original English chart, which is explicitly labeled 2010 and 2020.
What helped the network expand?
The review points to rising tea consumption in lower- and middle-income markets, alongside changes in what consumers wanted to drink. Better transport and distribution, trade agreements and lower import duties also helped make new routes possible.
At the same time, established tea markets offered room for more distinctive products. The report identifies specialty tea and product innovation as opportunities in markets where everyday tea consumption was already well established. That was the report’s assessment of the period and its outlook at publication, rather than a guarantee of demand for any particular product today.

What this means when you buy Chinese tea
A larger trade network gives a tea more ways to reach your cup. It also makes a clear description of origin more useful. Ask where the leaf was grown, who made it, which harvest it comes from, and whether the seller can distinguish the producer from the packer or exporter.
For Chinese tea, a broad country label is a starting point. The growing region and production style usually tell you more about the tea itself. A cultivar’s history is another part of the story, but it should not replace a clear statement of growing origin. Our companion guide to Fujian and Taiwan tea explores that distinction through the movement of plants, skills and businesses across the Taiwan Strait.
Once you have the tea, a simple gongfu brewing session offers a practical way to get to know it, one infusion at a time.
Source and editorial notes
Adapted from the Chinese review, “Summary of Changes in the Global Tea Trade Network,” compiled and translated by Zhang Shuo. The English terminology, regional trade directions and chart dates were checked against FAO, Changes in the global tea trade network (2024).
The report’s network comparisons use three-year averages centered on 2005 and 2020 and a harmonized sample of 116 countries. Trade data include re-exports. The regional chart compares 2010 and 2020. Original English figures are used in place of their smaller reproductions in the scan; photographs come from the original illustrated review. FAO is the source of the research and charts, not an endorser of Sandao.