Tea & Teaware Guides
Anhui Tea-Garden Area by City: The 2019 Land-Survey Data
Historical data note: this article uses the 31 December 2019 land-survey reference date and the source’s 2022 city compilation, not the latest tea-garden area.
Use the survey date, not the date you happen to read it
Anhui is associated with teas such as Keemun black tea, Huangshan Mao Feng, Taiping Houkui, Lu’an Gua Pian and Huoshan Huang Ya. The fame of those names, however, does not tell us how tea-garden land is distributed across the province.
The source article uses the Third National Land Survey. Its reference date is 31 December 2019. The provincial bulletin is dated 13 January 2022, and the source essay was published in July 2022. Those are historical land-use figures, not a claim about Anhui’s current planted area or this year’s harvest.
The provincial total and the units
The provincial bulletin reports tea gardens covering 153,600 hectares, with a rounded parallel figure of 2.3041 million mu. In the original Chinese presentation, those are 15.36 wan hectares and 230.41 wan mu. One wan means ten thousand; one hectare equals fifteen mu.
The published hectare and mu totals are independently rounded, so converting one rounded figure should not be expected to recreate every final digit of the other. Keep the original units and precision visible when comparing reports.
The city figures compiled in the original essay
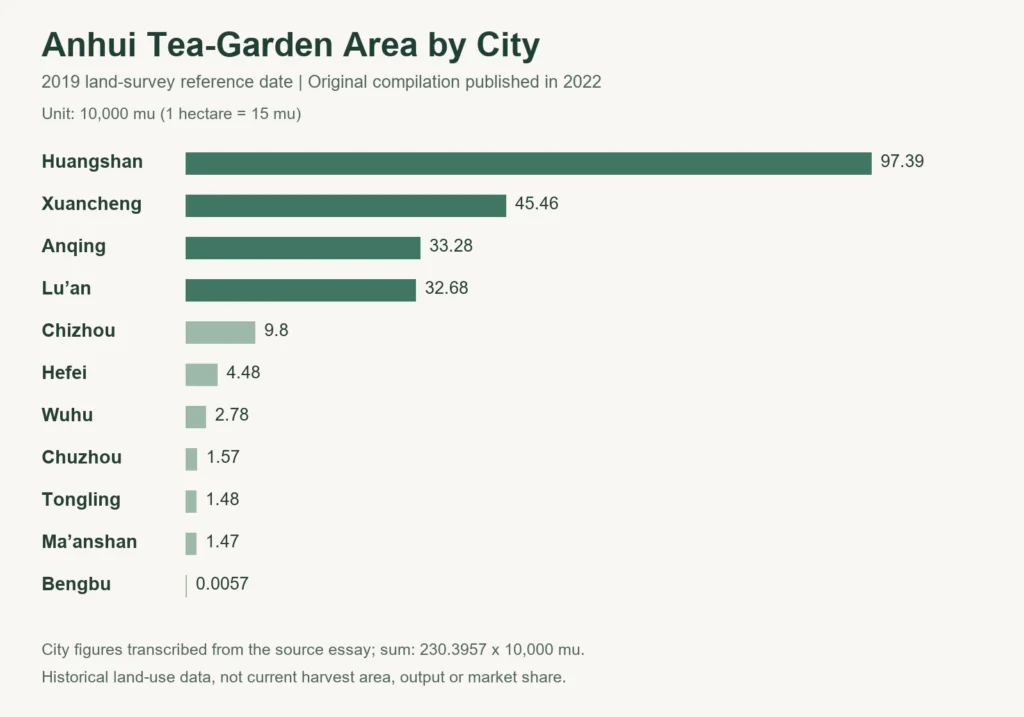
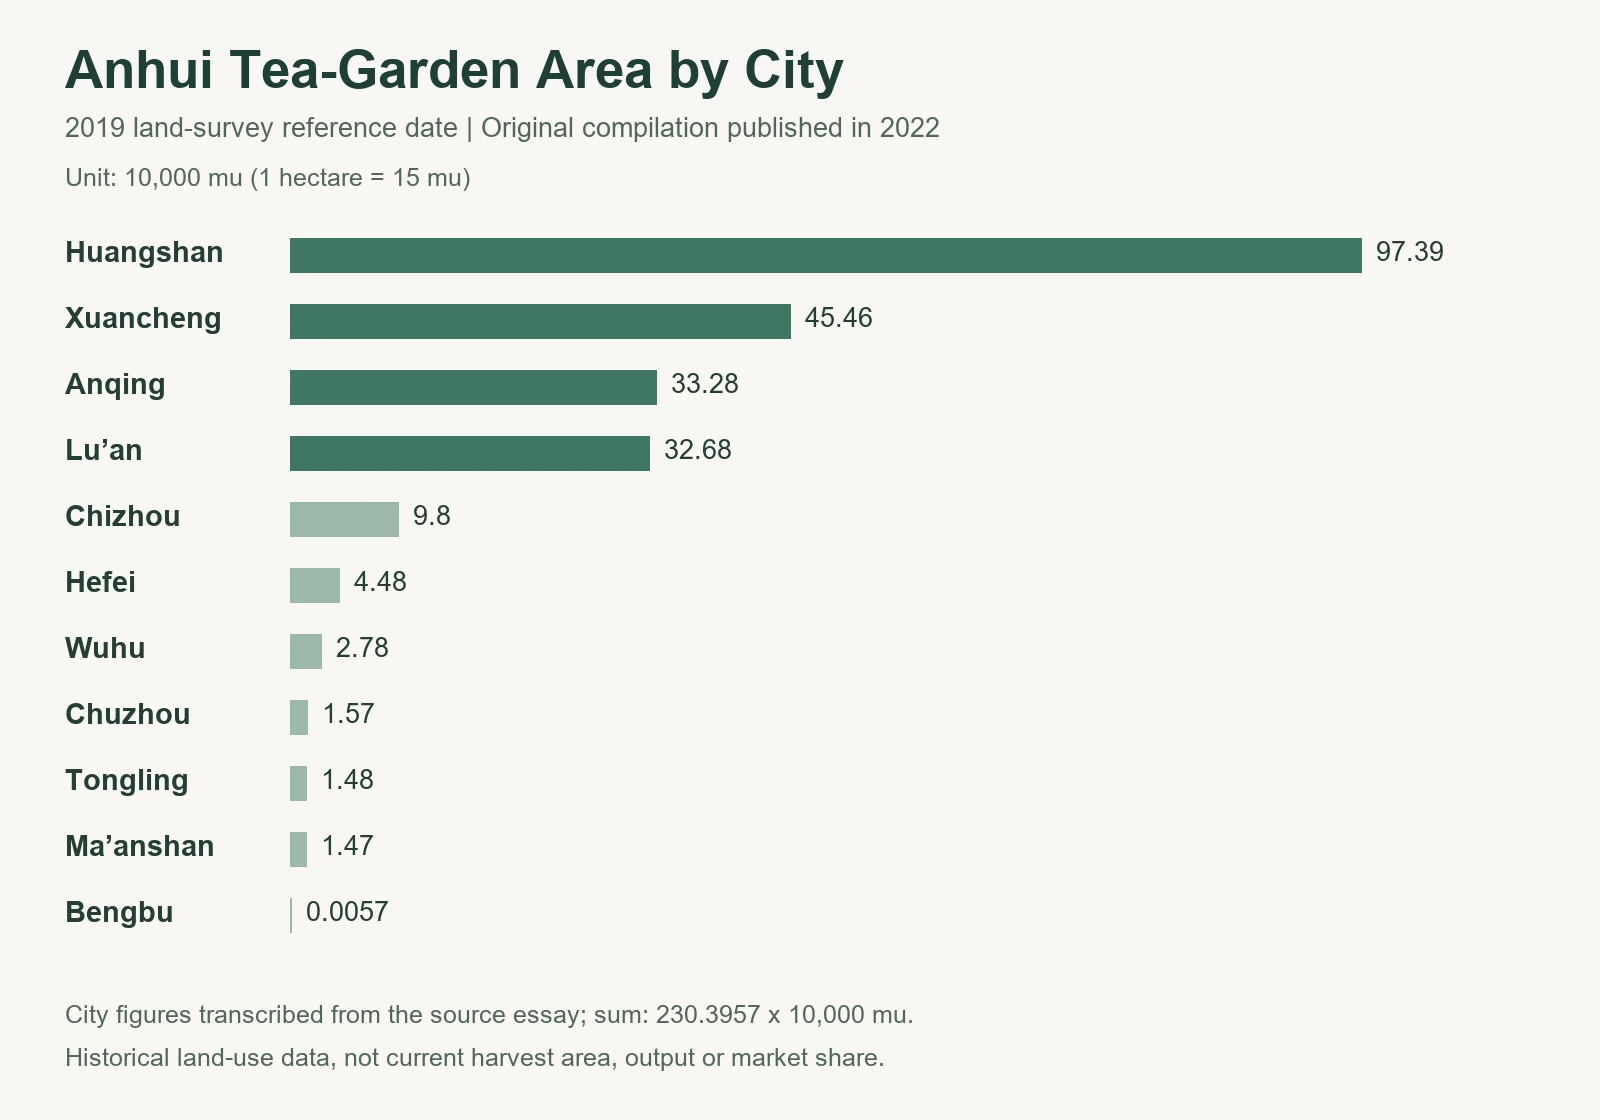
The following city values are transcribed from the source author’s compilation. They use units of ten thousand mu and add up to 230.3957, close to the rounded provincial total. Bengbu’s small entry is 0.0057 in that unit—57 mu, not 5,700 mu.
The chart replaces the source’s watermarked map with an English presentation of the same listed values. It is a comparison of the cities shown in that compilation; the absence of another city from the list should not automatically be read as a confirmed zero.
| City | Area (10,000 mu) | Approximate hectares |
|---|---|---|
| Huangshan | 97.39 | 64,926.67 |
| Xuancheng | 45.46 | 30,306.67 |
| Anqing | 33.28 | 22,186.67 |
| Lu’an | 32.68 | 21,786.67 |
| Chizhou | 9.8 | 6,533.33 |
| Hefei | 4.48 | 2,986.67 |
| Wuhu | 2.78 | 1,853.33 |
| Chuzhou | 1.57 | 1,046.67 |
| Tongling | 1.48 | 986.67 |
| Ma’anshan | 1.47 | 980.00 |
| Bengbu | 0.0057 | 3.80 |
What the ranking shows—and what it cannot show
In the source compilation, Huangshan ranks first, followed by Xuancheng, Anqing and Lu’an. Huangshan’s 97.39 ten-thousand mu is substantially larger than any other listed city. That is a useful counterpoint to a tea map drawn only from the fame of individual teas.
Area is not output, value, quality or market share. Nor is land classified as tea garden necessarily the same measure as an agricultural series reporting tea planted or harvested area. Before comparing another province, check that the reference year, definitions and units match. Apparent contradictions can come from mixing different statistical systems.
Read a land-use number with its label attached
For research or an industry presentation, keep four items together: the source, the reference date, the unit and the definition. That makes the figures reusable without turning a historical snapshot into a claim about today.
The original essay uses land data to ask a better question about a famous tea province. Its lasting lesson is methodological: look beyond reputation, but also avoid asking an area figure to answer questions it was not designed to measure.
References
- Anhui Third National Land Survey bulletin, dated 13 January 2022
- Xuancheng Third National Land Survey bulletin
Related reading
- Why Chinese Tea Companies Struggle to Scale: Five Barriers
- Telling China’s Stories Through a Cup of Tea
Explore Tea Industry Research in Tea & Teaware Guides
Source attribution
Reprinted from Deng Zengyong’s self-media publication, Tea Industry Management Review. Edited and translated into English by Sandao.